
Mitochondrial Dysfunction and Fatigue: What Routine Blood Work May Reveal
Fatigue is one of the most common — and most misunderstood — symptoms reported in clinical practice.
Many individuals are told their laboratory results are “normal.”
TSH? Within range.
Ferritin? Acceptable.
Glucose? Fine.
Yet persistent fatigue, brain fog, and reduced resilience continue.
This disconnect often arises because routine blood tests are designed to identify overt pathology — not necessarily to evaluate optimal cellular energy efficiency.
If you are unfamiliar with how fatigue can persist despite normal laboratory values, begin with our foundational overview:
👉 Why Am I Tired If My Labs Are Normal?
https://cellushine.net/pages/why-am-i-tired-if-my-labs-are-normal
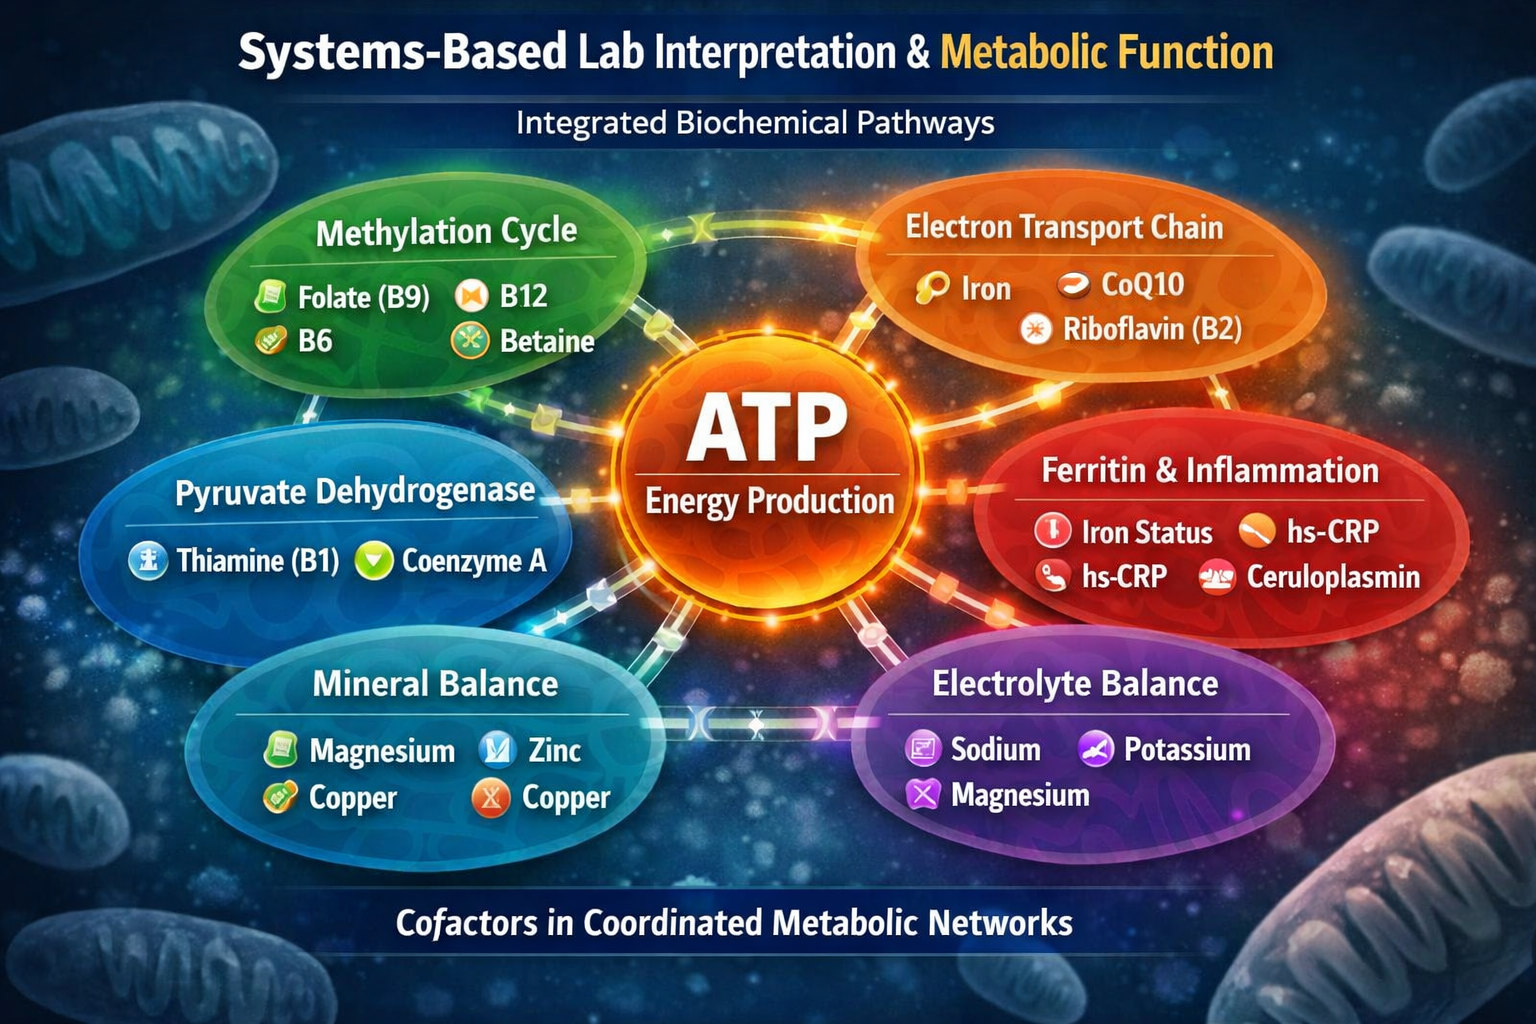
Understanding Mitochondria and Energy Production
Mitochondria generate ATP — the primary energy currency of the body.
Efficient mitochondrial function depends on multiple systems working together:
• Oxygen delivery
• Thyroid hormone signaling
• Micronutrient availability
• Glucose and fatty acid metabolism
• Cellular hydration and electrolyte balance
When one or more of these systems becomes inefficient, energy production may decline — even if no individual laboratory value falls outside its reference range.
For a detailed explanation of how mitochondrial function influences fatigue, review:
👉 Mitochondrial Dysfunction Explained
https://cellushine.net/pages/mitochondrial-dysfunction
Biomarker Patterns That Influence Cellular Energy
Routine blood work does not directly measure mitochondrial performance. However, specific biomarker patterns may provide indirect insight into systems that support ATP production.
Iron Status and Oxygen Transport
Ferritin, hemoglobin, hematocrit, and red blood cell indices influence oxygen delivery capacity. Even low-normal iron stores may affect mitochondrial oxygen utilization.¹
Pattern-based evaluation of these markers is discussed further in our:
👉 Educational Blood Lab Interpretation Guide
https://cellushine.net/pages/educational-blood-lab-interpretation
Thyroid Signaling and Metabolic Rate
Thyroid hormones regulate mitochondrial biogenesis and metabolic activity.²
Markers such as TSH, Free T4, and Free T3 may fall within reference ranges while subtle inefficiencies in conversion or cellular utilization persist.
Energy production is not determined by TSH alone — it reflects broader signaling dynamics.
Hydration and Electrolyte Balance
Hydration status influences:
• Plasma volume
• Oxygen delivery
• Nutrient transport
• Cellular membrane potential
• Enzymatic reactions required for ATP synthesis
Even mild electrolyte imbalances can affect cellular signaling and energy production efficiency.
For a deeper exploration of how hydration impacts cellular energy, see:
👉 Hydration & Electrolytes: Supporting Cellular Energy
https://cellushine.net/pages/hydration-electrolytes
Glucose Metabolism and Substrate Utilization
Glucose, fasting insulin patterns, triglycerides, and metabolic markers reflect substrate availability for ATP generation. Metabolic inflexibility has been associated with impaired mitochondrial efficiency.³
Even subtle dysregulation may influence perceived energy levels.
Inflammatory Load and Cellular Stress
Low-grade inflammation may interfere with mitochondrial signaling pathways and oxidative balance.⁴
Markers such as CRP, ESR, and white blood cell patterns provide context for inflammatory burden, which may influence energy metabolism.
Why Single Markers Rarely Explain Fatigue
Fatigue is rarely caused by one abnormal number.
More often, it reflects multiple small inefficiencies interacting simultaneously.
• Slightly low-normal ferritin
• Borderline thyroid conversion
• Mild hydration imbalance
• Subclinical metabolic stress
Individually, these markers may appear acceptable. Collectively, they may influence cellular energy dynamics.
This pattern-based approach is central to the:
👉 Cellular Energy Optimization Framework
https://cellushine.net/pages/cellular-energy-framework
Rather than asking:
“Is this lab normal?”
A more useful question may be:
“How do these biomarkers interact to influence ATP production?”
Research Context
Emerging research has linked mitochondrial dysfunction to fatigue-related conditions.⁵⁻⁶
It is important to note that routine blood panels are not direct mitochondrial tests. However, laboratory patterns may provide insight into systems that influence mitochondrial performance and energy metabolism.
Understanding context — not just isolated values — is critical.
Frequently Asked Questions
Can routine blood work detect mitochondrial dysfunction?
Not directly. However, biomarker patterns may suggest inefficiencies in systems that influence cellular energy production.
Why do I feel tired if my labs are normal?
Reference ranges are designed to identify disease thresholds. They do not always reflect optimal cellular performance or energy efficiency.
Which lab markers influence mitochondrial function?
Iron status, thyroid signaling, hydration balance, metabolic markers, and inflammatory patterns may all influence mitochondrial performance.
Is mitochondrial dysfunction the only cause of fatigue?
No. Fatigue is multifactorial. Mitochondrial efficiency represents one component within a broader physiological network.
References
-
Camaschella C. Iron-deficiency anemia. N Engl J Med. 2015.
-
Mullur R et al. Thyroid hormone regulation of metabolism. Physiol Rev. 2014.
-
Kelley DE et al. Skeletal muscle fatty acid metabolism. J Clin Invest. 1999.
-
Nunnari J, Suomalainen A. Mitochondria in health and disease. Cell. 2012.
-
Myhill S et al. Chronic fatigue syndrome and mitochondrial dysfunction. Int J Clin Exp Med. 2009.
-
Tomas C et al. Cellular bioenergetics in fatigue. Clin Sci. 2017.
